The Ventricular Autothreshold function is available in all pacing modes, which provide ventricular pacing except in SafeR and Dplus pacing mode.
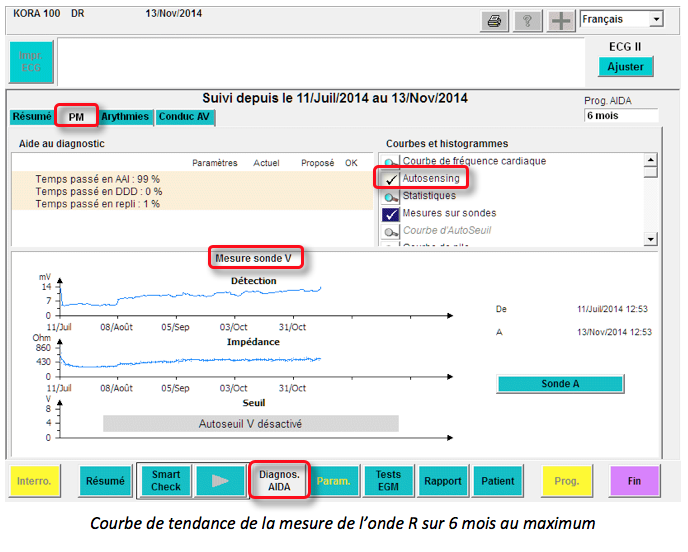
- periodical measurement (6 hours, 4 times a day) of the ventricular pacing threshold
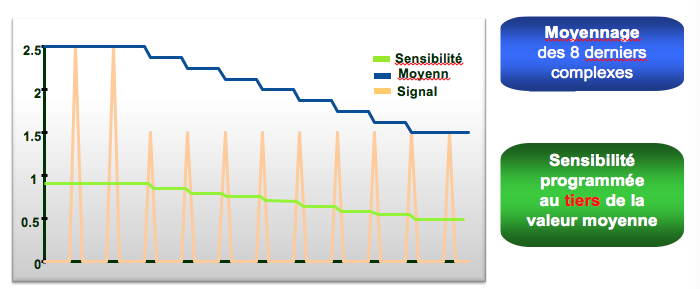
- automatic adjustment of the ventricular pacing amplitude to provide a 100% safety margin for the next 6 hours
- no beat to beat verification of capture efficiency
- a minimum ventricular amplitude is programmable
Periodical measurement of the ventricular threshold
The automatic threshold test sequence is automatically launched:
- every 6 hours
- after a ventricular manual threshold test
- after reprogramming of the auto threshold function from OFF to “MONITOR” or AUTO
- after a magnet test
- after programming of the V pulse width and V pacing polarity
- Threshold test can start as soon as calibration and fusion tests are successful.
- Output set at twice this value but not less than the programmed minimum amplitude.
- If threshold is not found, value of the previous test is kept and the test is relaunched in 15 minutes. There are up to 5 retries (except for SafeR and Dplus)*.
Waiting phase
8 cardiac cycles are delivered at the current pacing rate.
- ventricular amplitude programmed at 5 V (programmed pulse width)
- the calibration phase can start if the device could pace with an AV delay > 125 ms and a pacing rate < 95 min-1, during 8 cardiac cycles
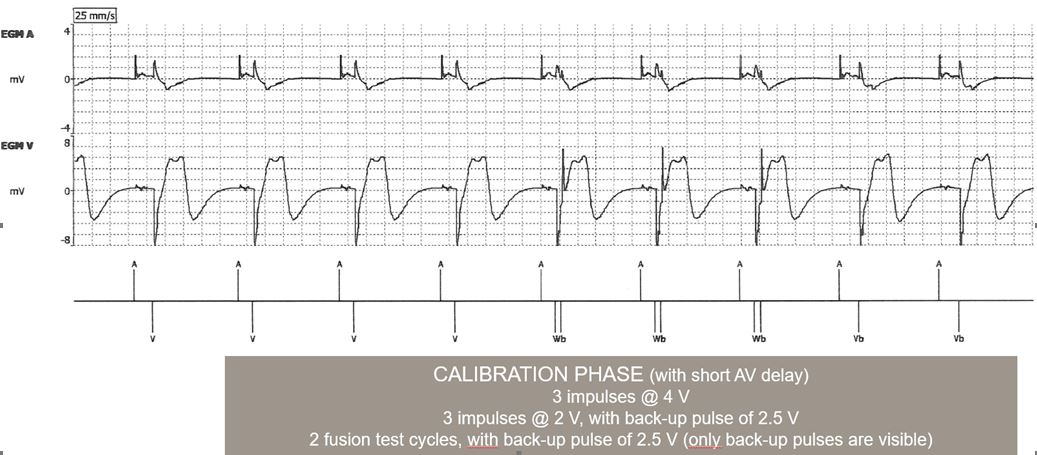
Calibration phase
The calibration phase is required to demonstrate an appropriate differentiation of the evoked potential response (EPR) and of the post-pacing polarization of the electrode. The signal is analyzed in a window of 65 ms following ventricular pacing.
- capture: post-pacing polarization+ evoked response
- non capture: post-pacing polarization
To reduce the risk of fusion beats during the calibration phase and the threshold test:
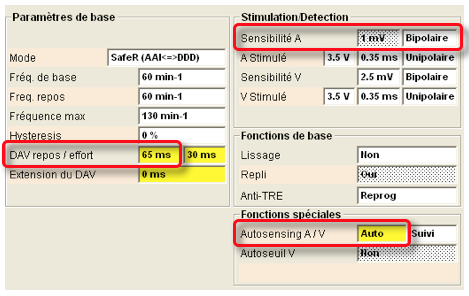
- the AV delay is shortened by 65 ms in DDD or VDD
- the escape interval is shortened by 65 ms in VVI, DDI and fallback mode switch
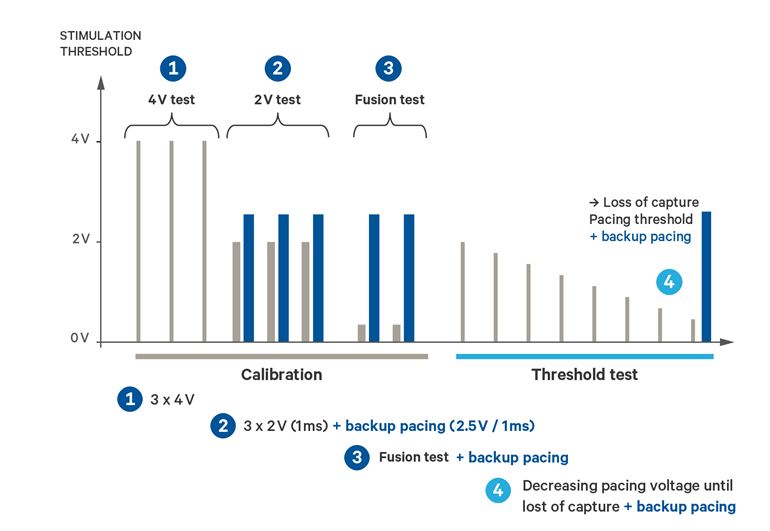
During the calibration phase, different pacing amplitudes are delivered:
- 3 ventricular stimuli at 4 V (programmed pulse width): first stimulus to avoid Wedensky effect; calibration on the 2 following spikes with evaluation of the signal in a 65 ms window; average of the 2 measurements
- 3 ventricular stimuli at 2 V + safety pulse at 2.5 V/1 ms: first stimulus to avoid Wedensky effect; calibration on the 2 following spikes with evaluation of the signal in a 65 ms window; average of the 2 measurements
- comparison of the average measurements at 4V and 2V to demonstrate similar evoked response
- During 2 cycles, the device assesses the fusion possibility. At the end of the AVD, it evaluates the signal in a 65 ms window and measures the ventricular amplitude. Then a back-up spike of 2.5 V/1 ms is applied at the end of the 65 ms window. During the 65 ms window
- If the device identifies spontaneous ventricular depolarisation similar to ventricular “capture”, fusion beats could be suspected for 4 V and 2 V capture verification (or it could be also an ectopic beat). It means that fusion could also occur during threshold test. Then the device restart the second calibration with the forced AV delay to 65 ms.
- If no depolarisation, then no fusion is suspected, the next step starts (Threshold test).
The calibration phase fails when:
- diagnosis of fusion beats (even after the second calibration)
- excessive polarization (poor ratio evoked response/polarization)
- pacing threshold higher than 2 V
If the calibration phase fails, the ventricular amplitude is set to 5 V and test restarts 6 hours later.
Threshold test
The threshold test is performed at the programmed pulse width and pacing polarity.
- threshold test starts at 1.85 V
- steps of 0.15 V
- threshold test stops after a loss of capture or at the amplitude of 0.2 V
- after a loss of capture, a safety pulse is delivered after 65 ms (amplitude 2.5 V, pulse width 1 ms)

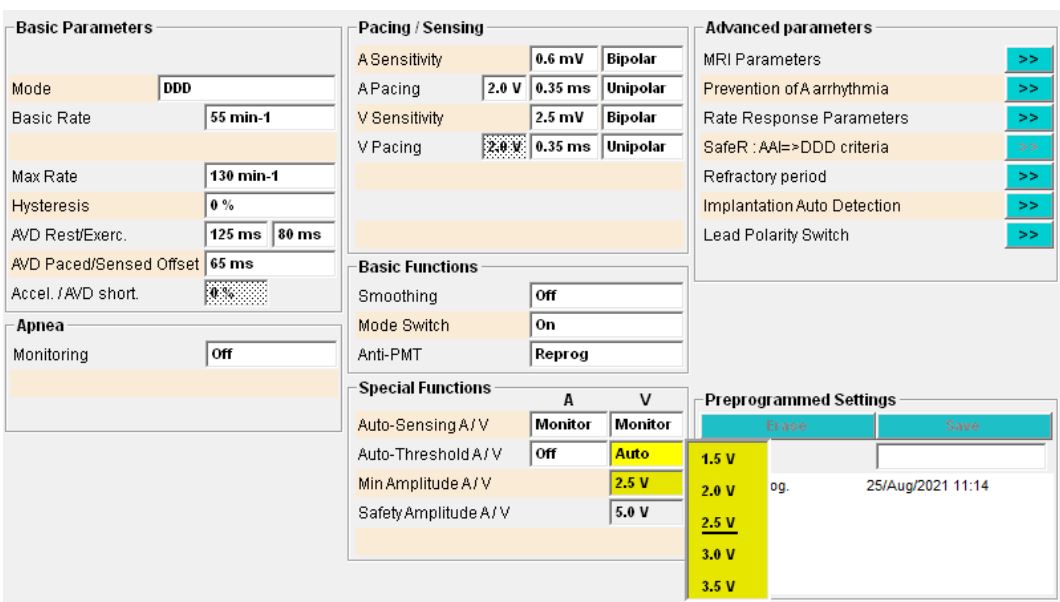
Adjustment of the amplitude
- the minimum ventricular amplitude is 1.5 V (programmable)
- automatic adjustment of the ventricular pacing amplitude to provide a 100% safety margin for the next 6 hours (measured threshold x 2)
- threshold test starts at 1.85 V
- steps of 0.15 V
- stops after a loss of capture, a safety pulse is delivered after 65 ms (amplitude 2.5 V, pulse width 1 ms)
Programmable parameters
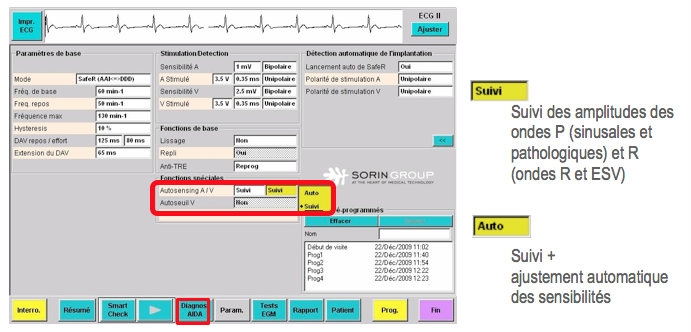
- AutoThreshold: Auto, “Monitor”, Off
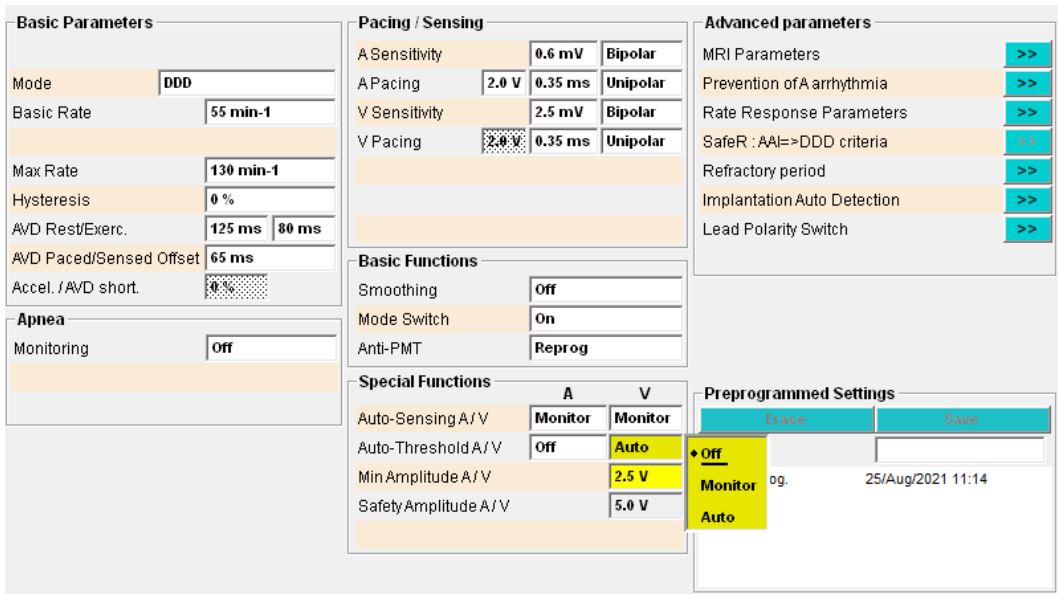
- minimum ventricular amplitude (Vmin): 1.5 V to 5.0 V (nominal: 2.5V)