Stabilisation of a tachycardia against a backdrop of atrial arrhythmia; a very difficult diagnosis
Patient
A 70-year-old man with a PLATINIUM DR dual-chamber implanted in secondary prevention for post-infarction ischemia with an ejection fraction of 20% and narrow QRS. The patient consults after presenting numerous episodes on telecardiology follow-up.
Programming
3 zones avec :
- A Slow VT monitoring zone, without therapy, starting at 150/min with a persistence
of 30 cycles
- A VT zone starting at 190/min with a first line of therapies consisting of ATP
- A VF zone starting at 230/min
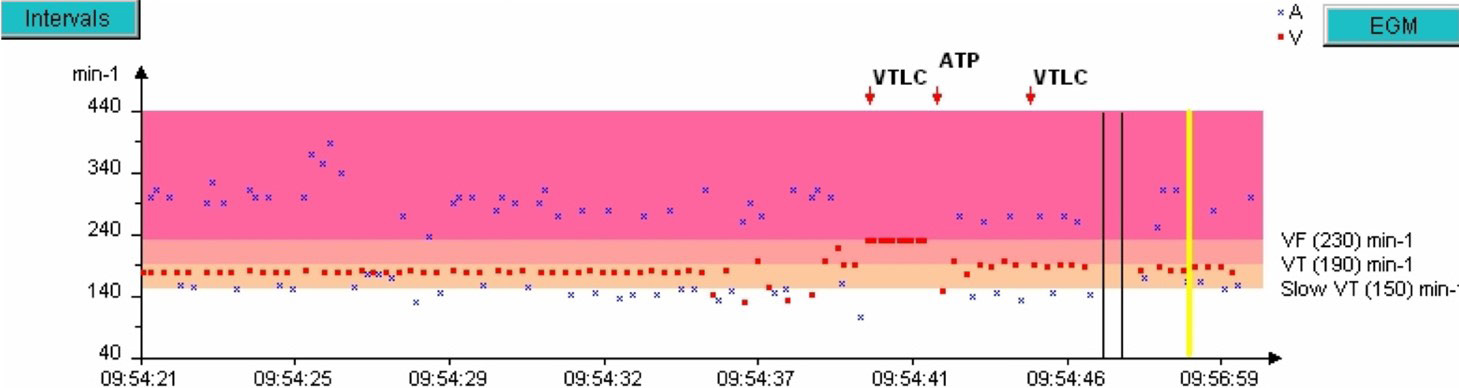
Rate interval plot
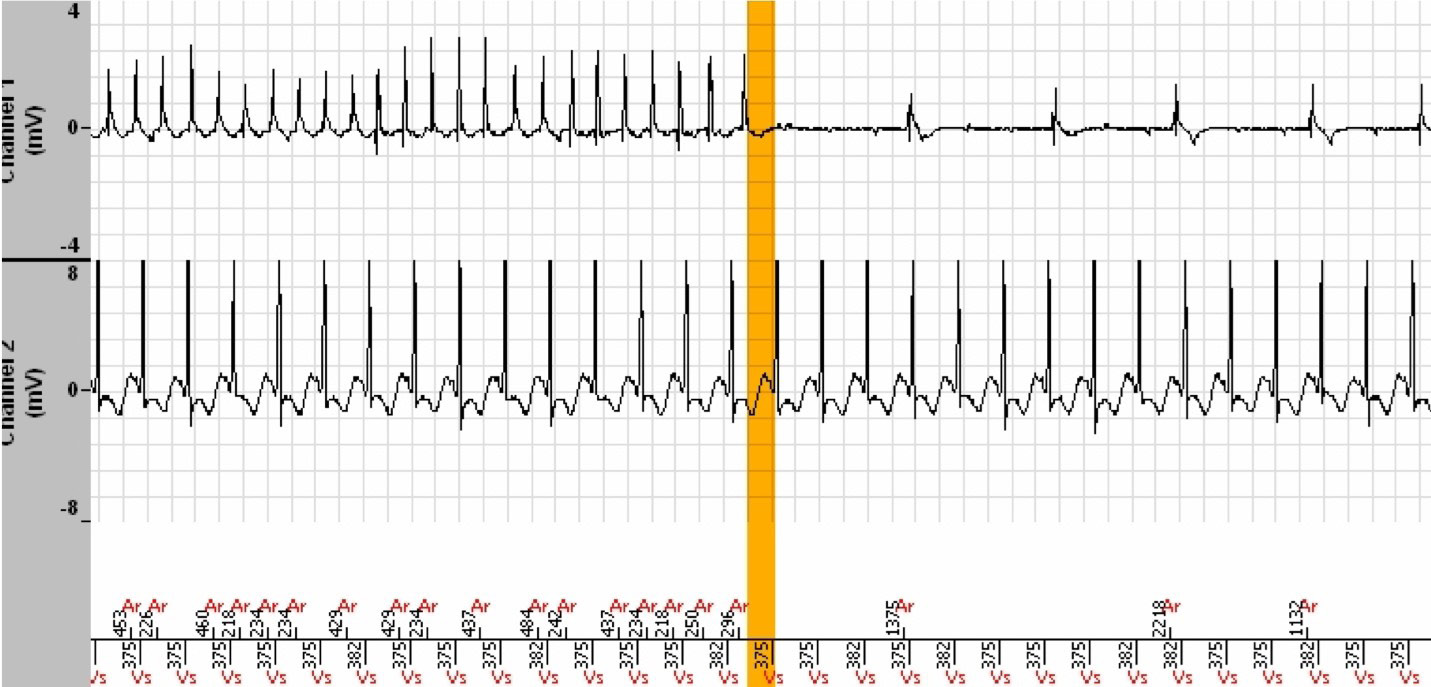
The episode lasted 7 minutes and 38 seconds and the tachogram below shows only the last 3 minutes. During the preceding 4 minutes 30 seconds, the ventricular rate is perfectly stable in the Slow VT zone.
EGM
Interpretation
- All stored episodes comprise AF. We can therefore expect regularisation phases of ventricular rhythm with incorrect temporary diagnoses of VT.
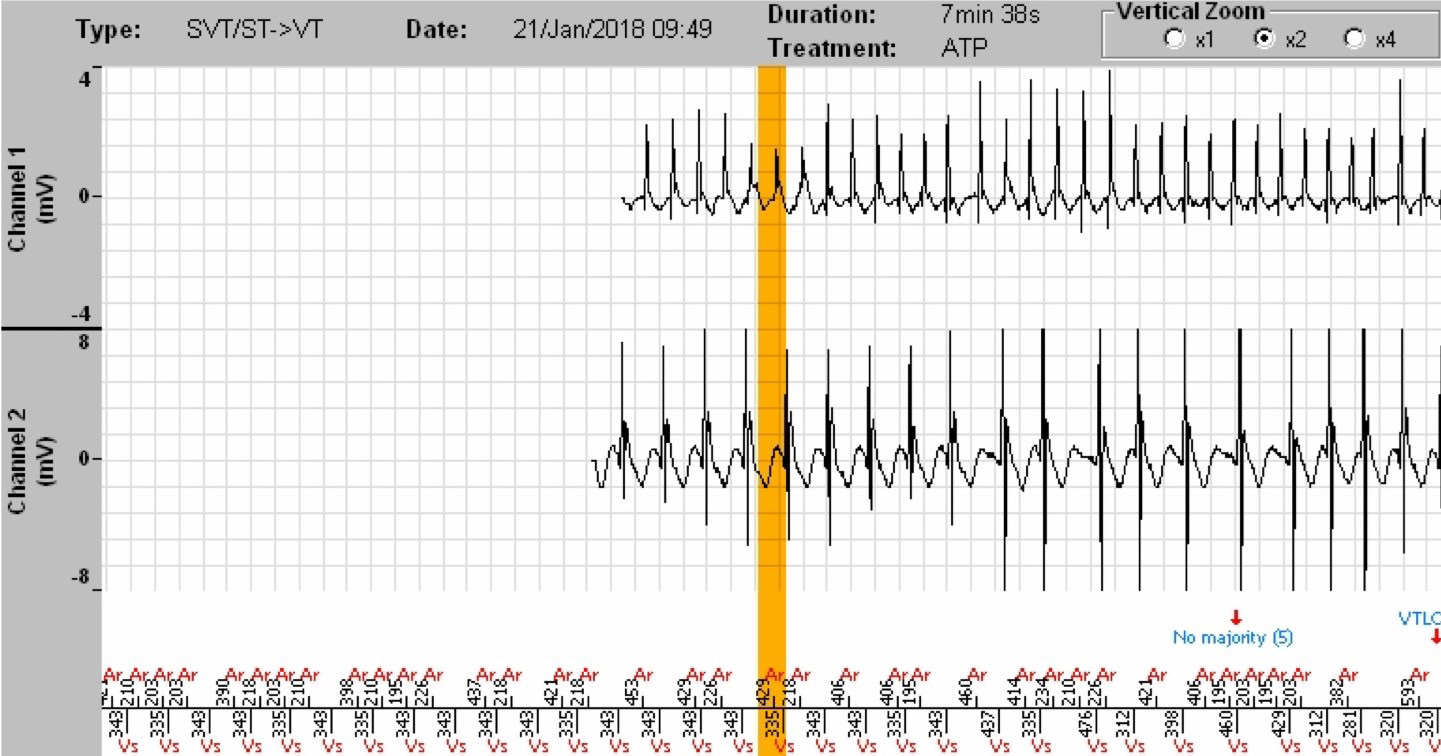
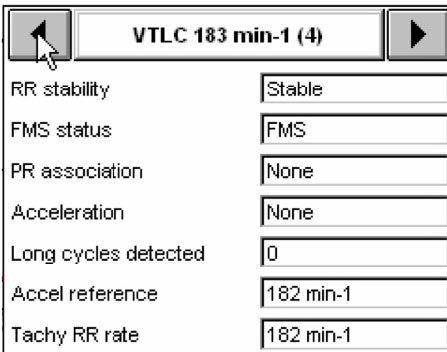
- This episode, which lasts 7 minutes and 38 seconds, shows a stable ventricular rhythm (335 to 343 ms) in a Slow VT zone, and the defibrillator diagnoses a Slow VT at the beginning of the episode (tachogram and EGM not shown at the time of the diagnosis).
- No therapy is programmed in the Slow VT zone, hence no surprise in the fact that the Slow VT continues.
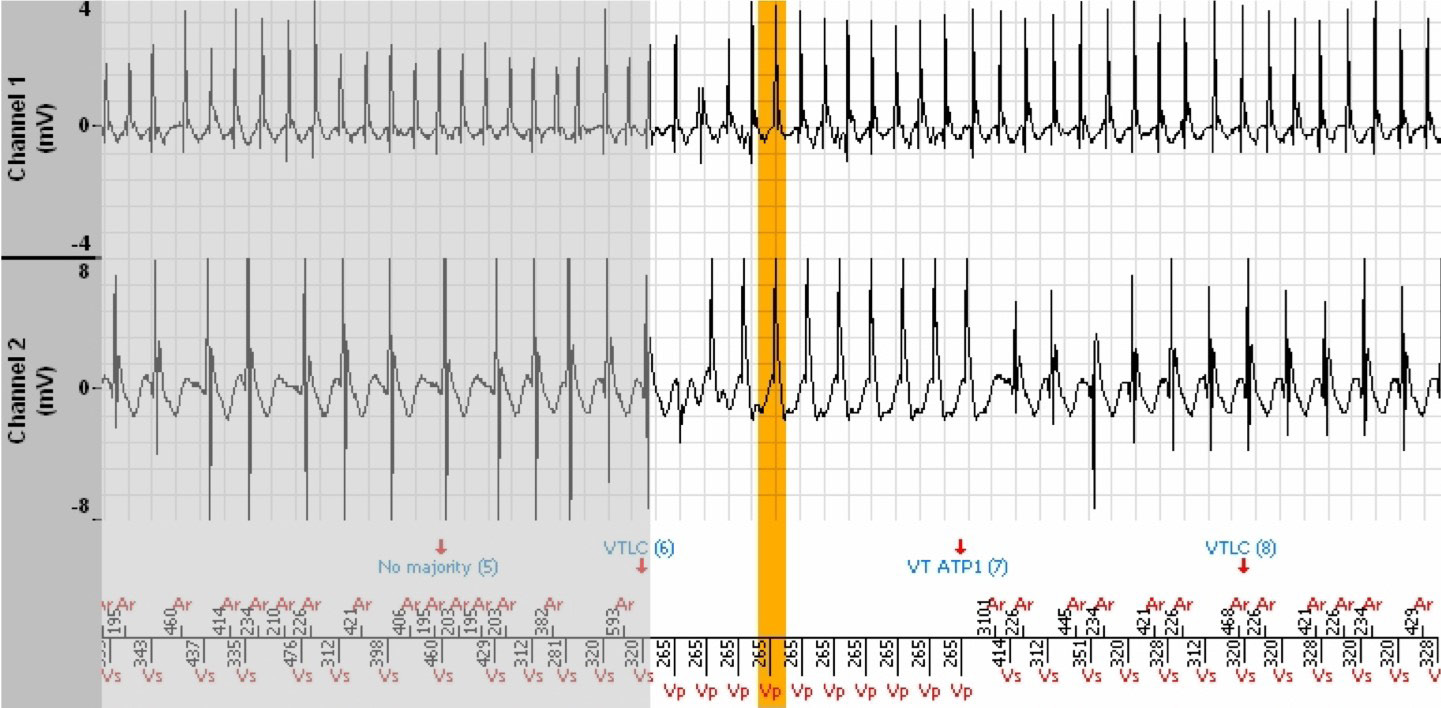
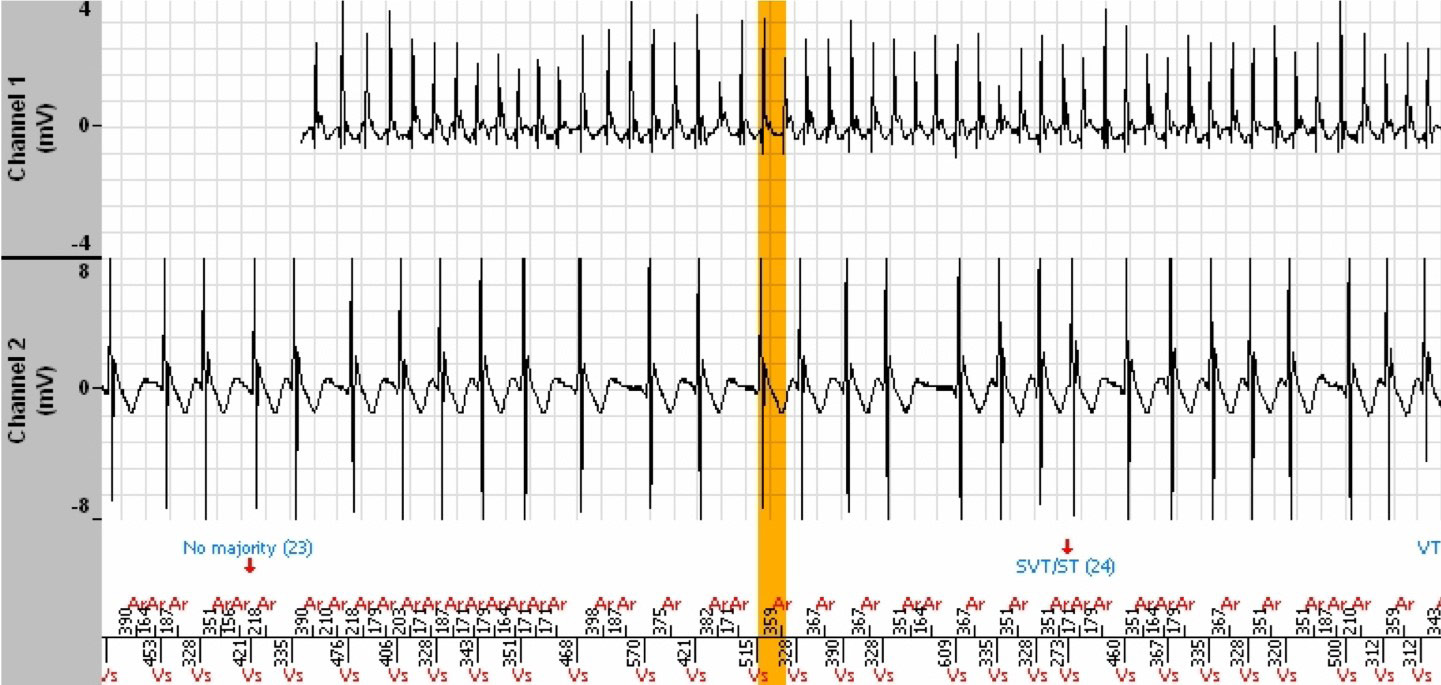
- Then, suddenly, the rhythm becomes unstable (starting at the orange vertical bar) with cycles whose coupling interval is in the Slow zone (non Tachy) for at least 3 out of 8 cycles (but less than 6), which leads to annotation n°5 « No majority ». This majority maintains the VT persistence counter (no reset to zero, no increment).
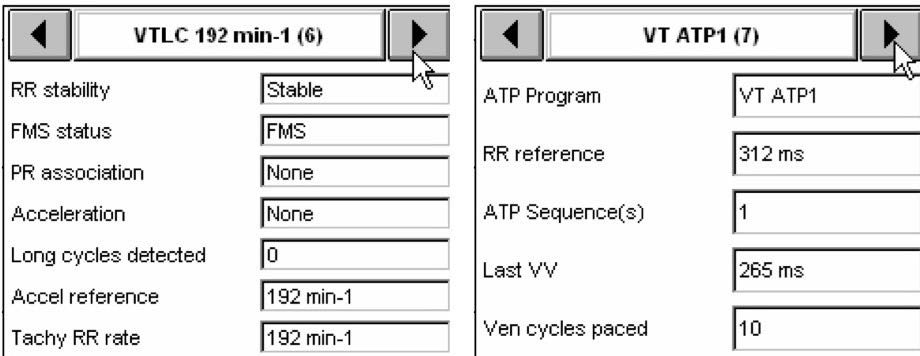
- Then appears an acceleration in rate which leads the tachycardia into the VT zone (annotation n°6). The incrementation of the VT persistence counter had begun during the Slow VT phase, and the VT counter reached the programmed persitence shortly
thereafter. The persistence being reached and the average rate of the last 4 Tachy/VF cycles in the VT zone induce a VT zone ATP (annotation n°7).
- Indeed, annotation n°4 revealed a diagnosis of VT in the VT zone that had begun to increment the VT persistence counter.
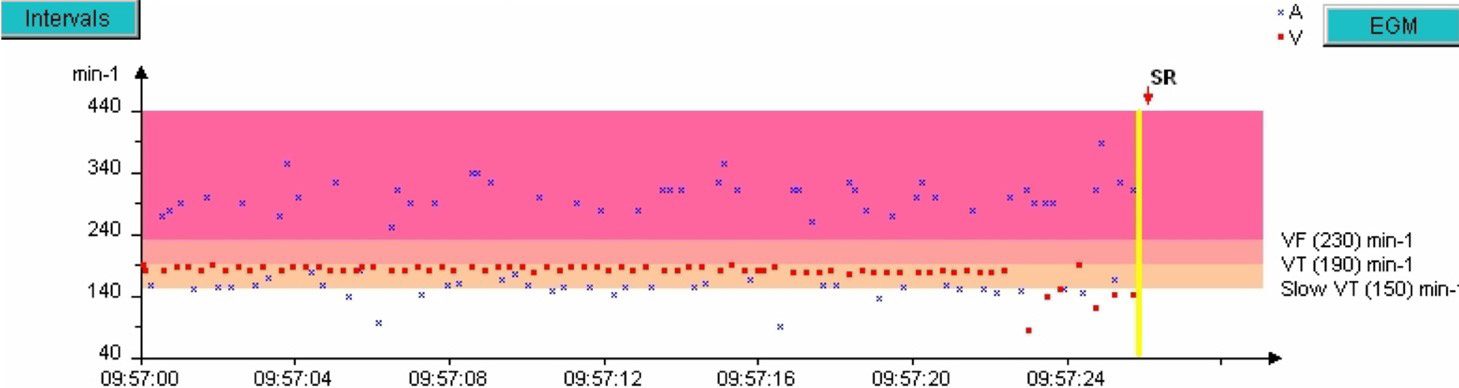
- The ATP does not terminate the tachycardia, which returns to the Slow VT zone with perfect stability, with no defibrillator intervention for the remaining 3 minutes, until the sudden slowing of the rate and termination of the episode.
- However, is this treated tachycardia truly a VT or a tachycardia conducted to the ventricles and accelerated by the AF? The answer lies (perhaps) in the analysis of the other memorised episodes.
- In this EGM, it is indisputably a conducted AF with irregular ventricular rhythm, appropriately diagnosed as SVT.
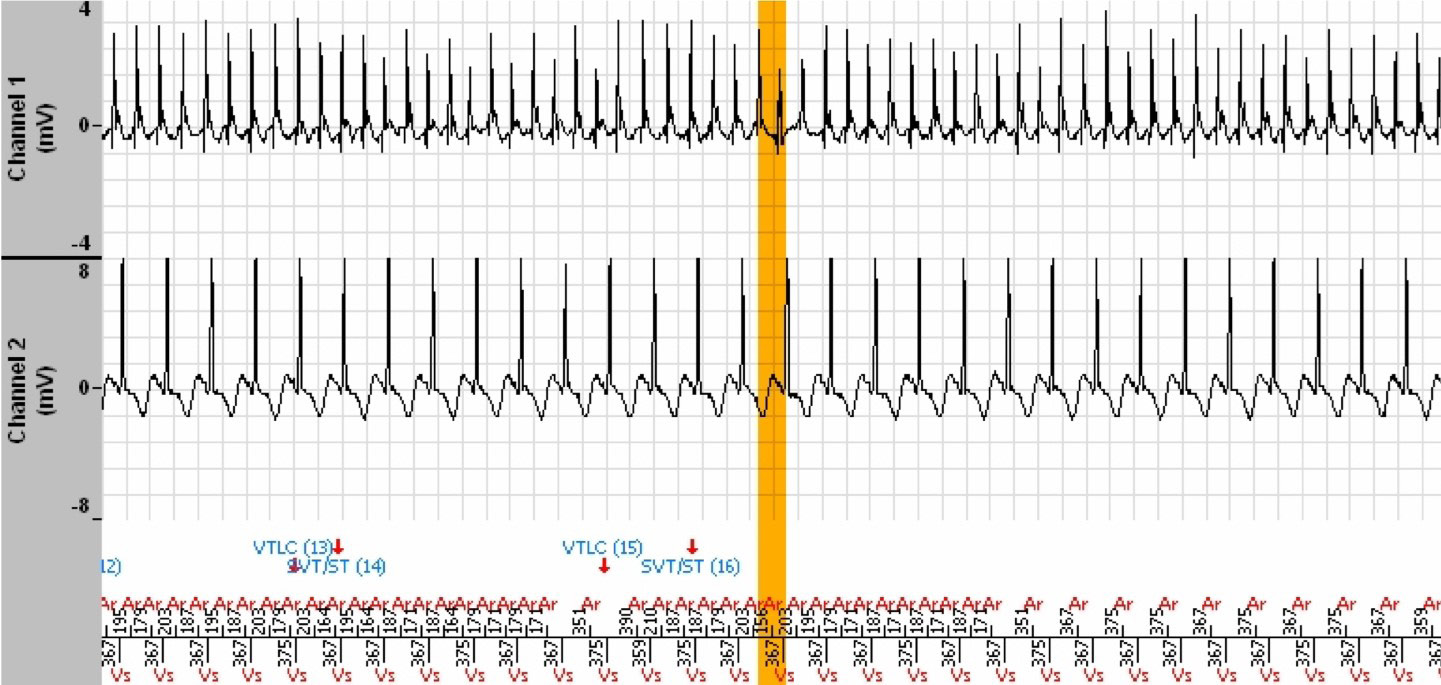
- In this other EGM, of another episode labelled Slow VT, the tachycardia is perfectly stable, monomorphic and of very different morphology compared to the ventriculograms of the conducted AF.
- Evidence that this latter EGM does indeed show ventricular tachycardia lies in the observation of the continuation of this tachycardia whereas the AF has terminated spontaneously.
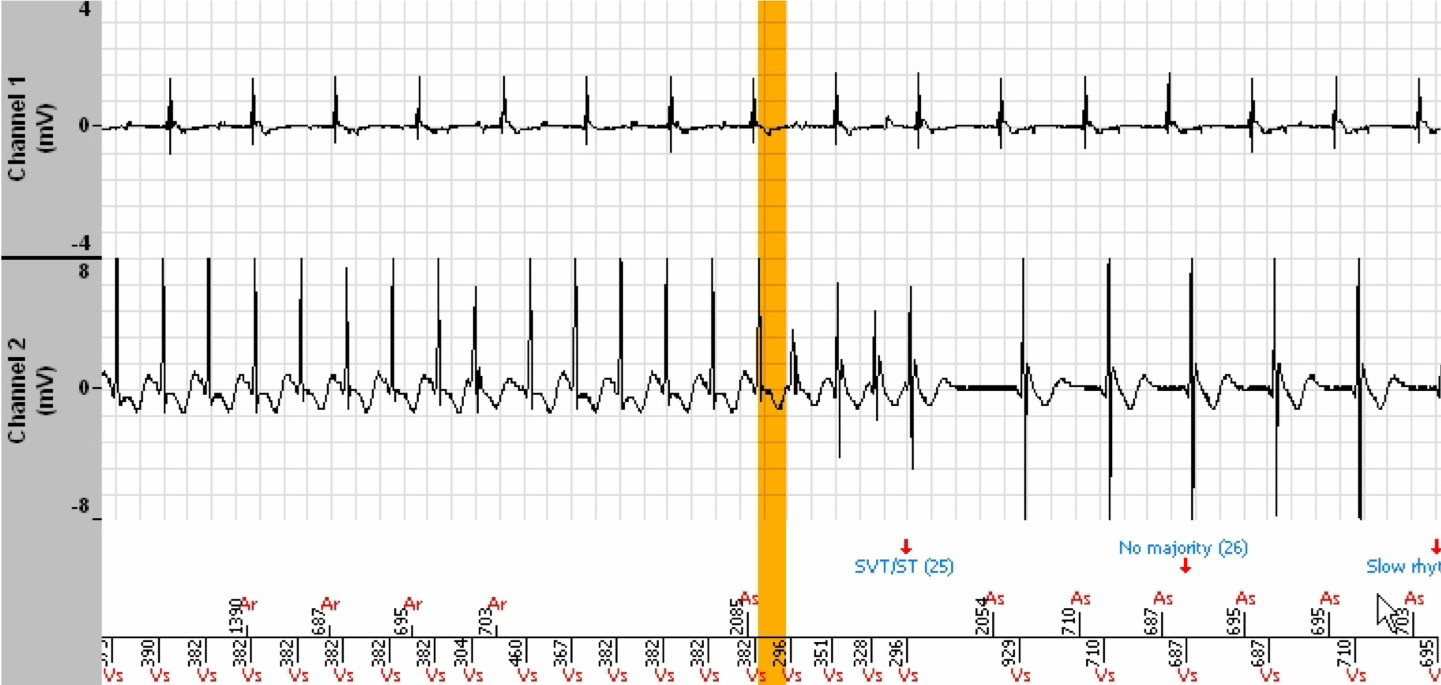
- When the ventricular tachycardia terminates, we find the conducted PR sinus rhythm combination. Note the morphology of the QRS in sinus rhythm which corresponds to that of the conducted AF cycles, and to that of the 11 cycles that follow the orange bar of the EGM of our clinical case. Those cycles which precede the orange bar and those that follow the ATP have a different morphology (less amplitude), which evokes a VT. The morphology of this VT is also different from the obvious VT of the episode shown above.
- The interpretation of the tracing of this clinical case is thus the following (subject to discussion): The tachycardia is a Slow VT which terminates, followed by ventricular cycles conducted by the AF which enter the VT zone, completing the persistence
initiated well before, and induce an ATP which results in the return of the Slow VT. This Slow VT is different from that of another episode, revealed by the two EGMs above.
Comments
- The interpretation of this tracing is particularly difficult and, as usual, one must read all of the memory data before arriving to any conclusion.
- The PARAD+ algorithm would undoubtedly gain in specificity if a morphological analysis function was added.
Take home message
A correct diagnosis can only result from a meticulous analysis of all of the information stored by the device.
The statistics, the evolution curves of the parameters and all EGMs must be analysed.
The « Analysis » function of the EGMs is a valuable tool for understanding the functioning of the device and for determining the necessary reprogramming.
Un diagnostic correct ne peut résulter que d’une analyse méticuleuse de toutes les informations stockées par l’appareil.
Les statistiques, les courbes d’évolution des paramètres et tous les EGM doivent être analysés.
La fonction “ Analyse “ des EGM est un outil précieux pour comprendre le fonctionnement de l’appareil et pour déterminer la reprogrammation nécessaire.
[/trp_languag

