Lead fracture and multiple capacitor charges - Incepta ICD
Patient
- 60-year-old male implanted with an Incepta single-chamber defibrillator; telemedicine alert for abnormal impedance measurement
Detection and impedance curves
- stable right ventricular shock impedance
- abnormal right ventricular pacing impedance (> 2000 Ohms)
- the impedance curve shows a number of abnormal values and a clear jump when compared to previously stable values
Episode list since previous interrogation
- multiple episodes of non-sustained VT recorded at the same time as the abnormal pacing impedance values
- 2 episodes classified as VT with no therapy delivered
Episode summary
- episode classified in the VT zone
- no therapy delivered
EGM layout
- oversensing of fast signals on the bipolar sensing channel; no oversensing on the shock channel
- oversensing on the ventricular channel of signals of variable amplitude and morphology; occasional large amplitude signals saturating the amplifiers; the shock channel makes it possible to differentiate these signals from spontaneous ventricular activity
- end of oversensing
Interval plot
- appearance suggestive of lead dysfunction; the presence of a cloud of points that is generally incompatible with ventricular arrhythmia
- very fast cycles (bordering on blanking) with slower cycles
Take home message
- the defibrillation lead is the weak link in the defibrillation system, with rates of malfunction varying between models
- in this patient, the combination of high impedance values and the abnormal EGM trace is highly suggestive of lead fracture; there is oversensing of fast, intermittent signals of varying morphology with very short cycle lengths close to the ventricular blanking period; some signals are very large, saturating the amplifiers; these ‘make-break’ potentials are highly suggestive of lead fracture with probable breach of the conductor rather than an insulation defect; the graph also shows a characteristic cloud of points with very short cycles
- in this asymptomatic patient, remote monitoring facilitated an early diagnosis and prevented inappropriate therapies; this helps avoids a succession of inappropriate shocks which, even if diverted, consume energy and shorten the life of the device
- in cases of lead dysfunction, anomalies generally occur in different stages: initially, the device may record multiple episodes of non-sustained VT without any anomalies in lead parameters; subsequently, a clear break in impedance, threshold and right ventricular sensing curves may be observed; as the duration of over-sensing episodes increases, multiple shocks may occur
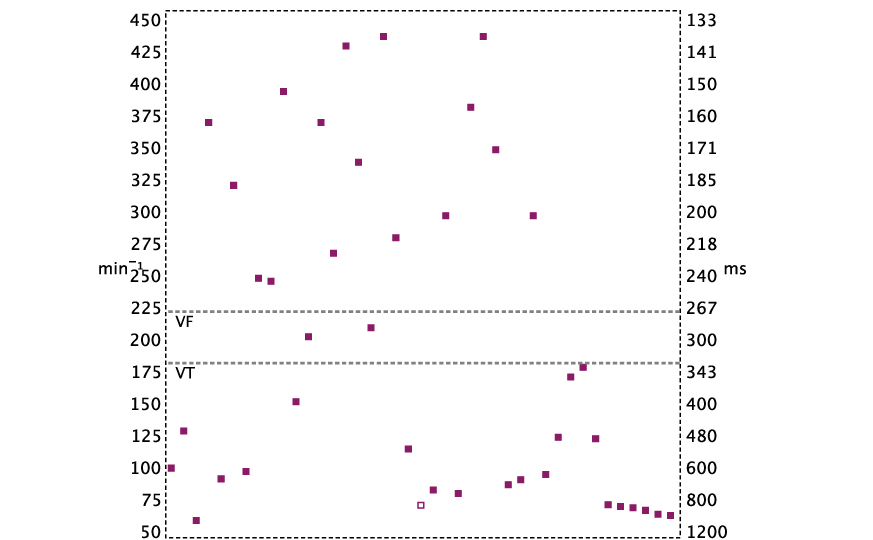
The interval plot is suggestive of lead dysfunction with a cloud of points appearance: highly variable ventricular cycle lengths, very short cycles at the limit of ventricular blanking after ventricular sensing, etc.

